Evaluating your security posture through the Dashboard
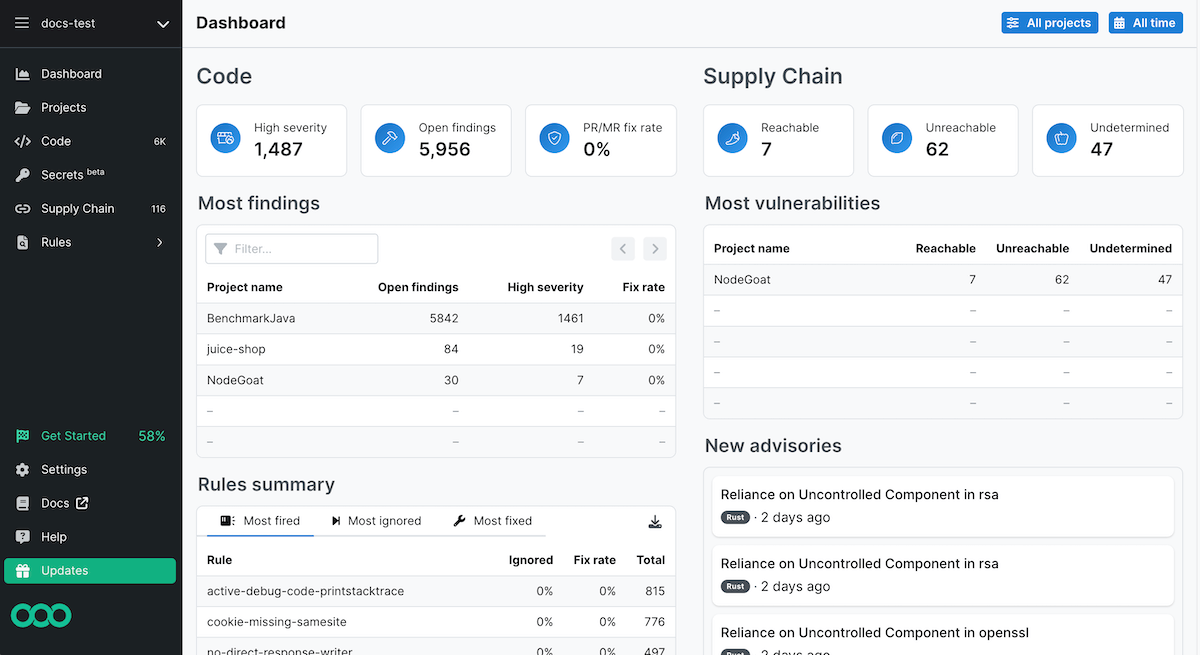
The Semgrep AppSec Platform Dashboard is an overview of your organization’s security posture from data aggregated within the Semgrep AppSec Platform. With these metrics you can:
- View recurring security issues, consequently taking action on them.
- Improve communication between developer teams and security teams.
- Detect vulnerabilities early, thereby preventing these from persisting through to the next stage of product delivery, such as QA.
You can access the Dashboard by logging into the Semgrep AppSec Platform.
Assessing security readiness at a glance

The Code widget displays high-level security analytics across your entire organization. This includes:
- High severity
- Findings generated by a rule with the severity value set to
ERROR. These include security backdoors and highly vulnerable code. If you filter for another time period than All time the displayed number badge compares the number of high-severity findings within the given time period against the previous time period. - Open findings
- The number of open findings over the given time period. The badge number indicates whether this number has gone up or down compared to the previous timeframe. If you filter for another time period than All time the displayed number badge compares the most recent number of open findings against the previous timeframe.
- Comment fix rate
- The percentage of findings that were fixed when findings surfaced to developers through PR or MR comments in previous scans. If you filter for another time period than All time the displayed number badge compares PR and MR fix rate in the given time period against the previous time period.
Filtering findings by time
The Dashboard displays data from scans for the All time by default. This time range can be set to a narrower value. By broadening the time range, security teams are able to see total numbers and statistics across an entire time period. Narrow time ranges can give insights into the most recent vulnerabilities creeping into the project.
To change the time range of scan data over time:
- Click the Last 1 month button.
- Select a time range from the drop-down box. The Dashboard, including all widgets, reloads to reflect data from the selected time period.
Filtering findings by projects
The Dashboard displays data from scans for all of the organization's projects by default. Select one or a few projects to filter the dashboard widgets to only reflect scans from selected projects. Selecting a few projects gives you a more targeted view of those projects' security posture.
To change the projects filter:
- Click the All projects button.
- Select projects from the drop-down box. The Dashboard, including all widgets, reloads to reflect data from the selected projects.
Summarizing the security posture of a project
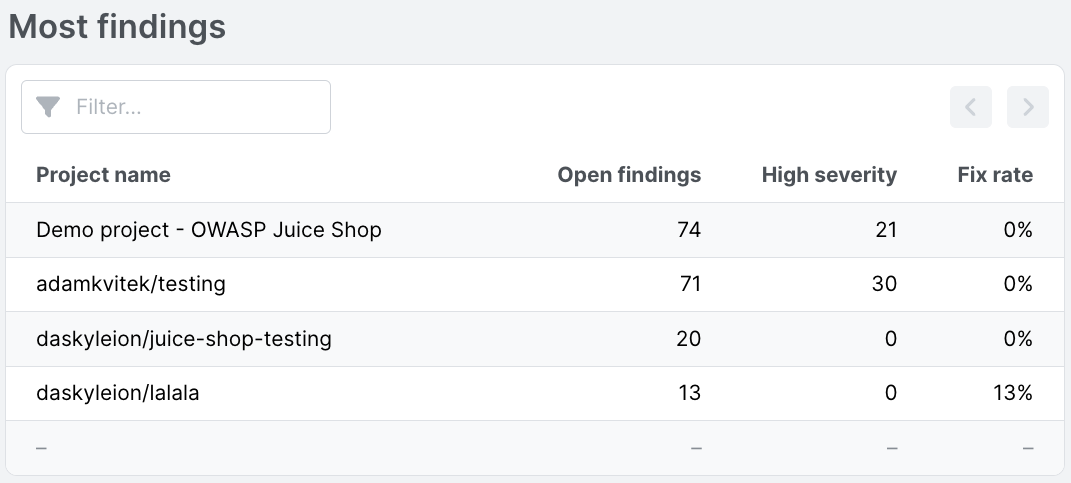
The Most findings widget displays open findings, high severities, and fix rates per-project. Through this view, you can see a specific number of findings in given projects. The columns are arranged in descending order, from the project with the greatest amount of findings to the least.
To view the project’s findings, click the project’s name. This takes you to the Findings page, where you can filter, sort, and triage findings.
Assessing rule performance
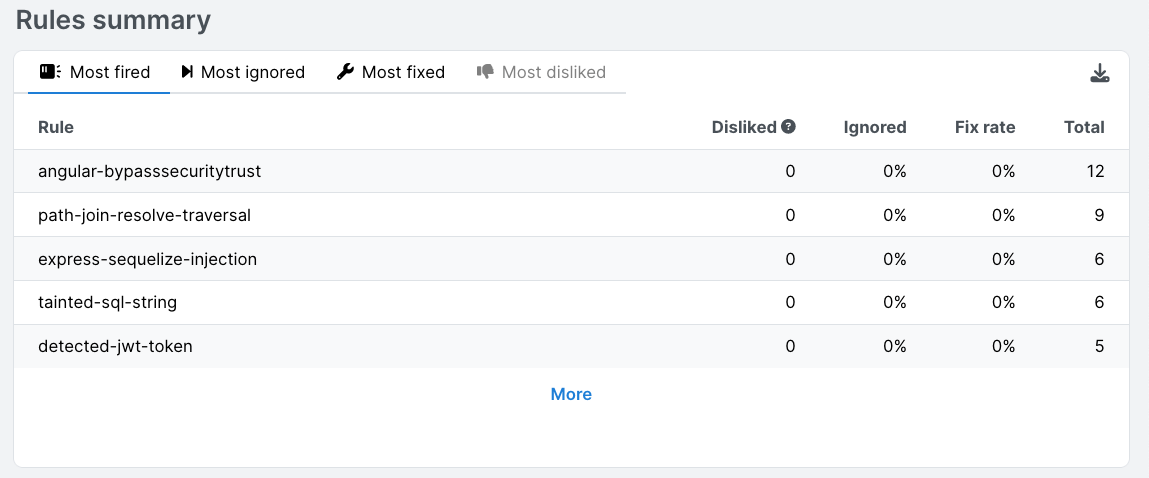
The Rules summary widget provides a summary report for rule metrics, such as what rules are ignored or fired the most.
These data points can serve as a starting point for the following security audits:
- Investigating the relevance or quality of a rule. For example: Is this rule useful, or does it detect too many false positives?
- Are there underlying issues in the codebase that result in recurring patterns of insecure code?
- Are there rules that developers don’t resolve? Semgrep helps identify such rules, which helps to form insights into possible causes.
Using Dashboard with Semgrep Supply Chain
Semgrep Dashboard can display vulnerable dependency findings of Semgrep Supply Chain.
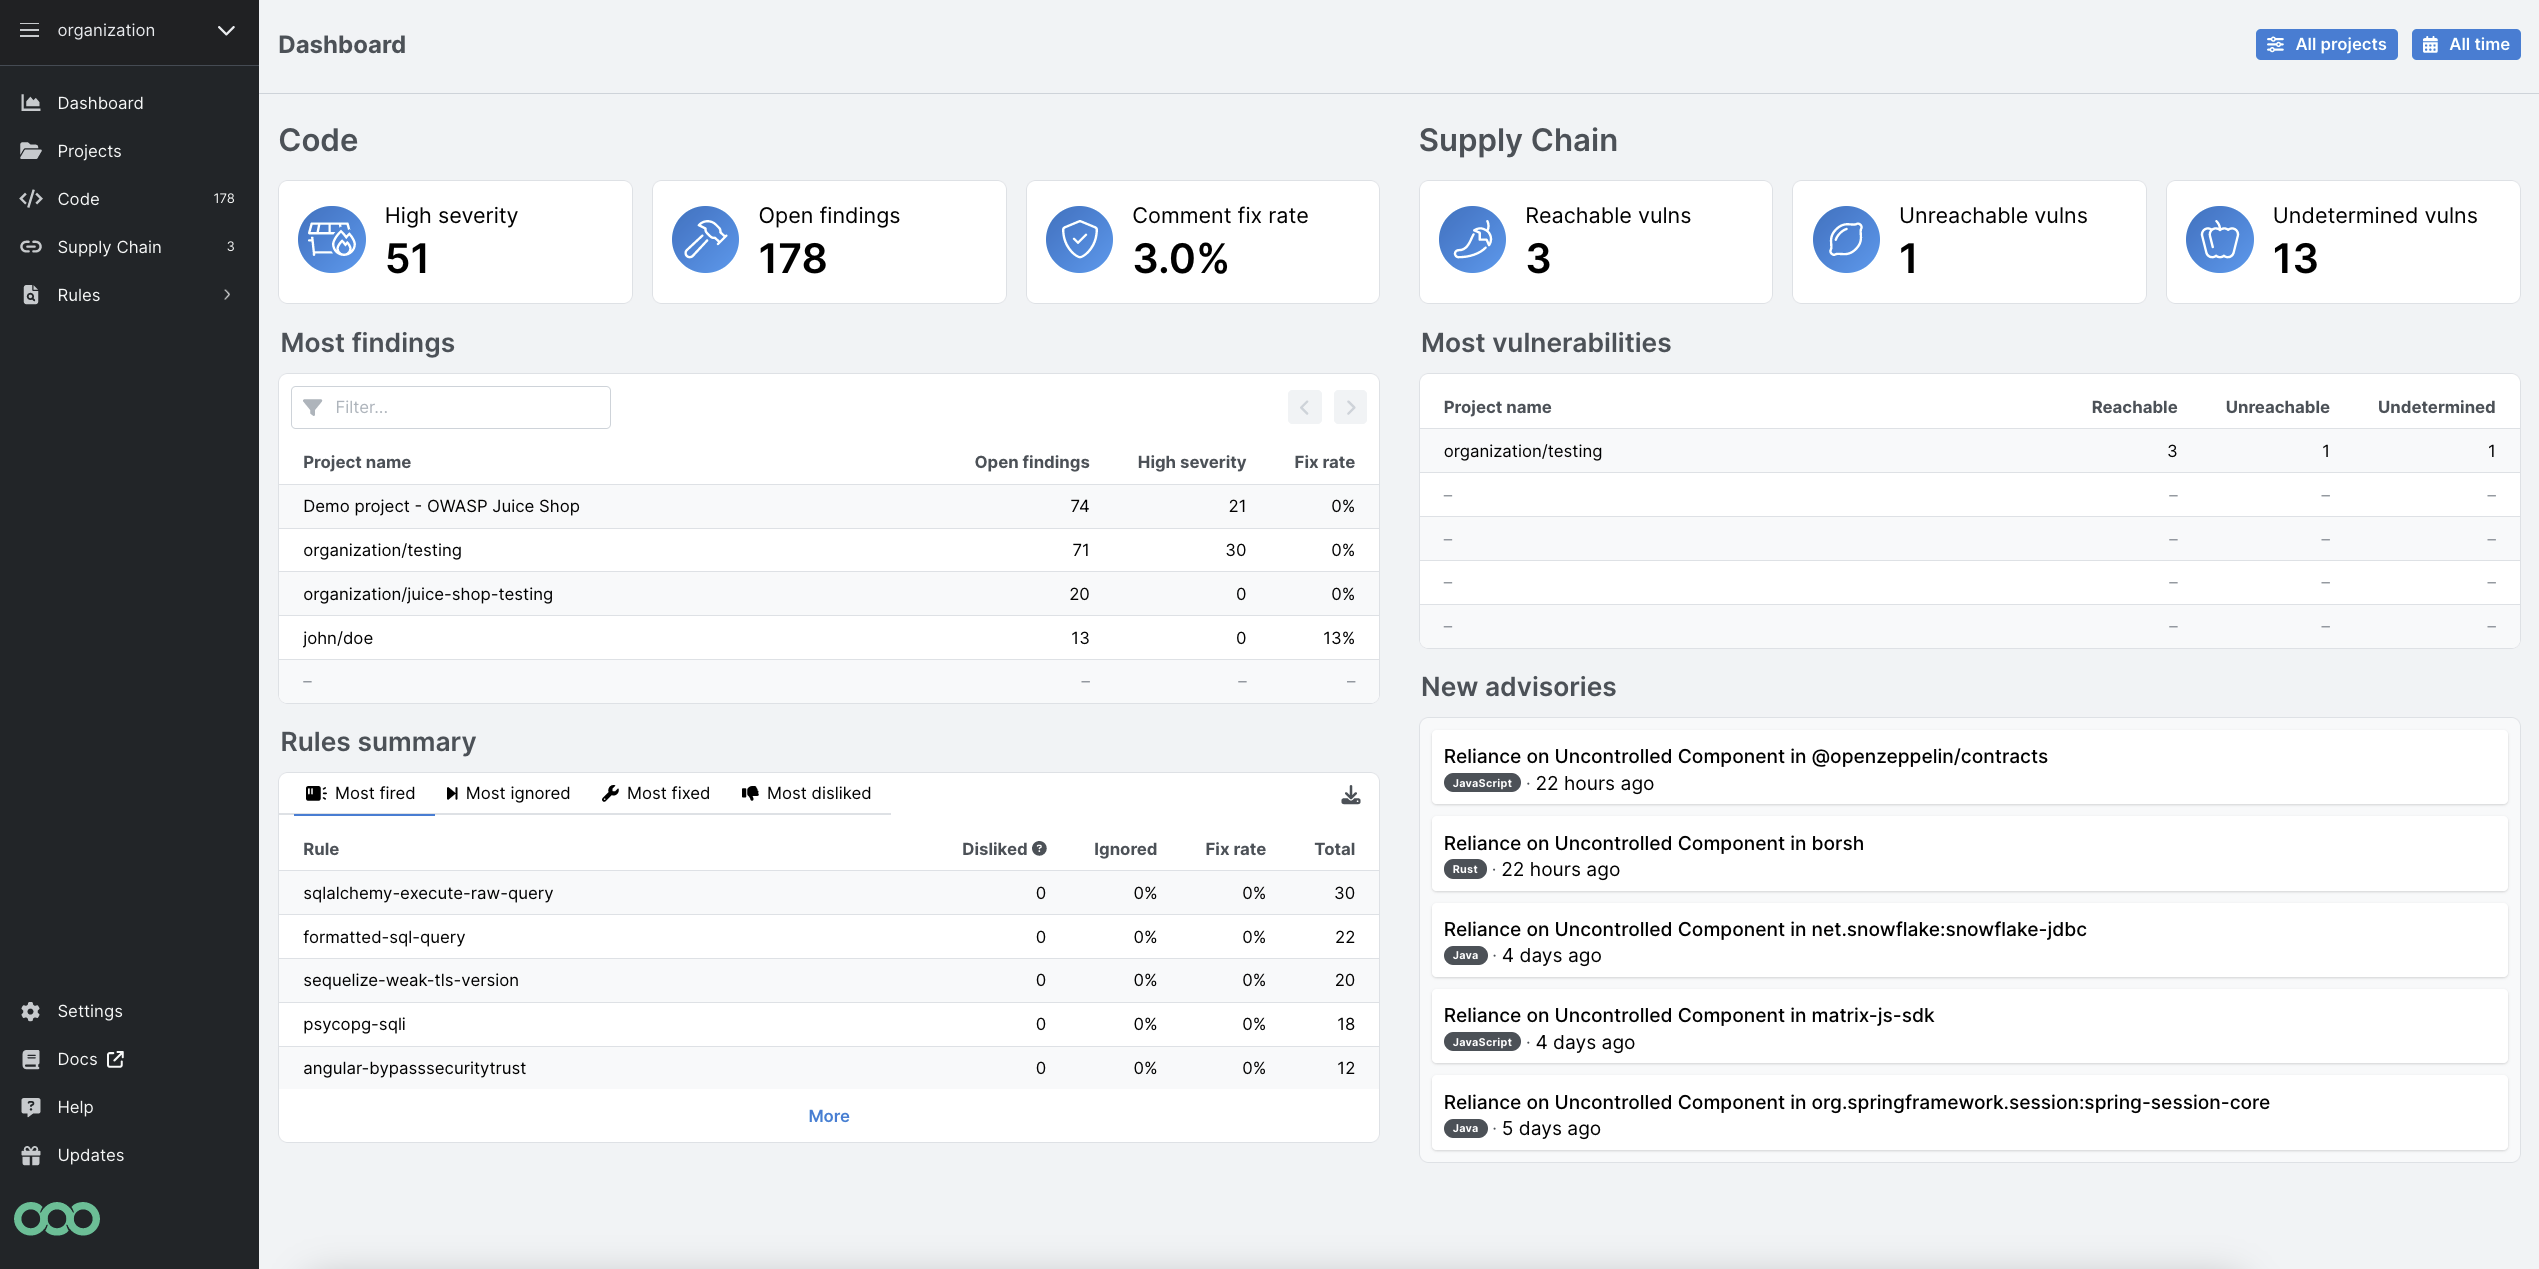
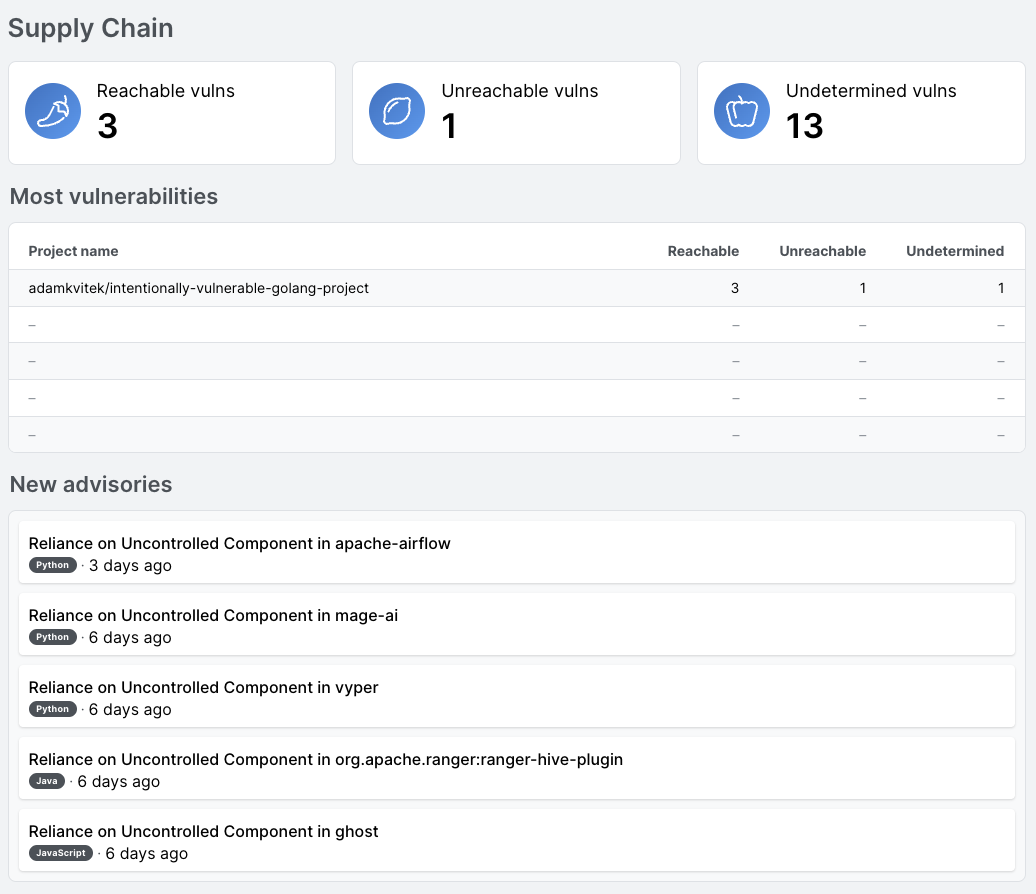
Semgrep Supply Chain dashboard consists of three widgets:
- Supply Chain
- Contains three items: Reachable, Unreachable, and Undetermined vulnerabilities.
- Most vulnerabilities
- The number of dependency vulnerabilities over the given time period next to the calendar icon.
- New advisories
- Announcements of new vulnerabilities.
Filters mentioned in previous sections Filtering findings by time and Filtering findings by projects are also applied to Semgrep Supply Chain widgets.
See also
Additional references
Not finding what you need in this doc? Ask questions in our Community Slack group, or see Support for other ways to get help.